
Problem: Instructors using W. W. Norton’s ebook platform wanted greater visibility into students’ activity within their course ebooks. This included metrics such as time spent in the ebook and performance on digital homework assignments.
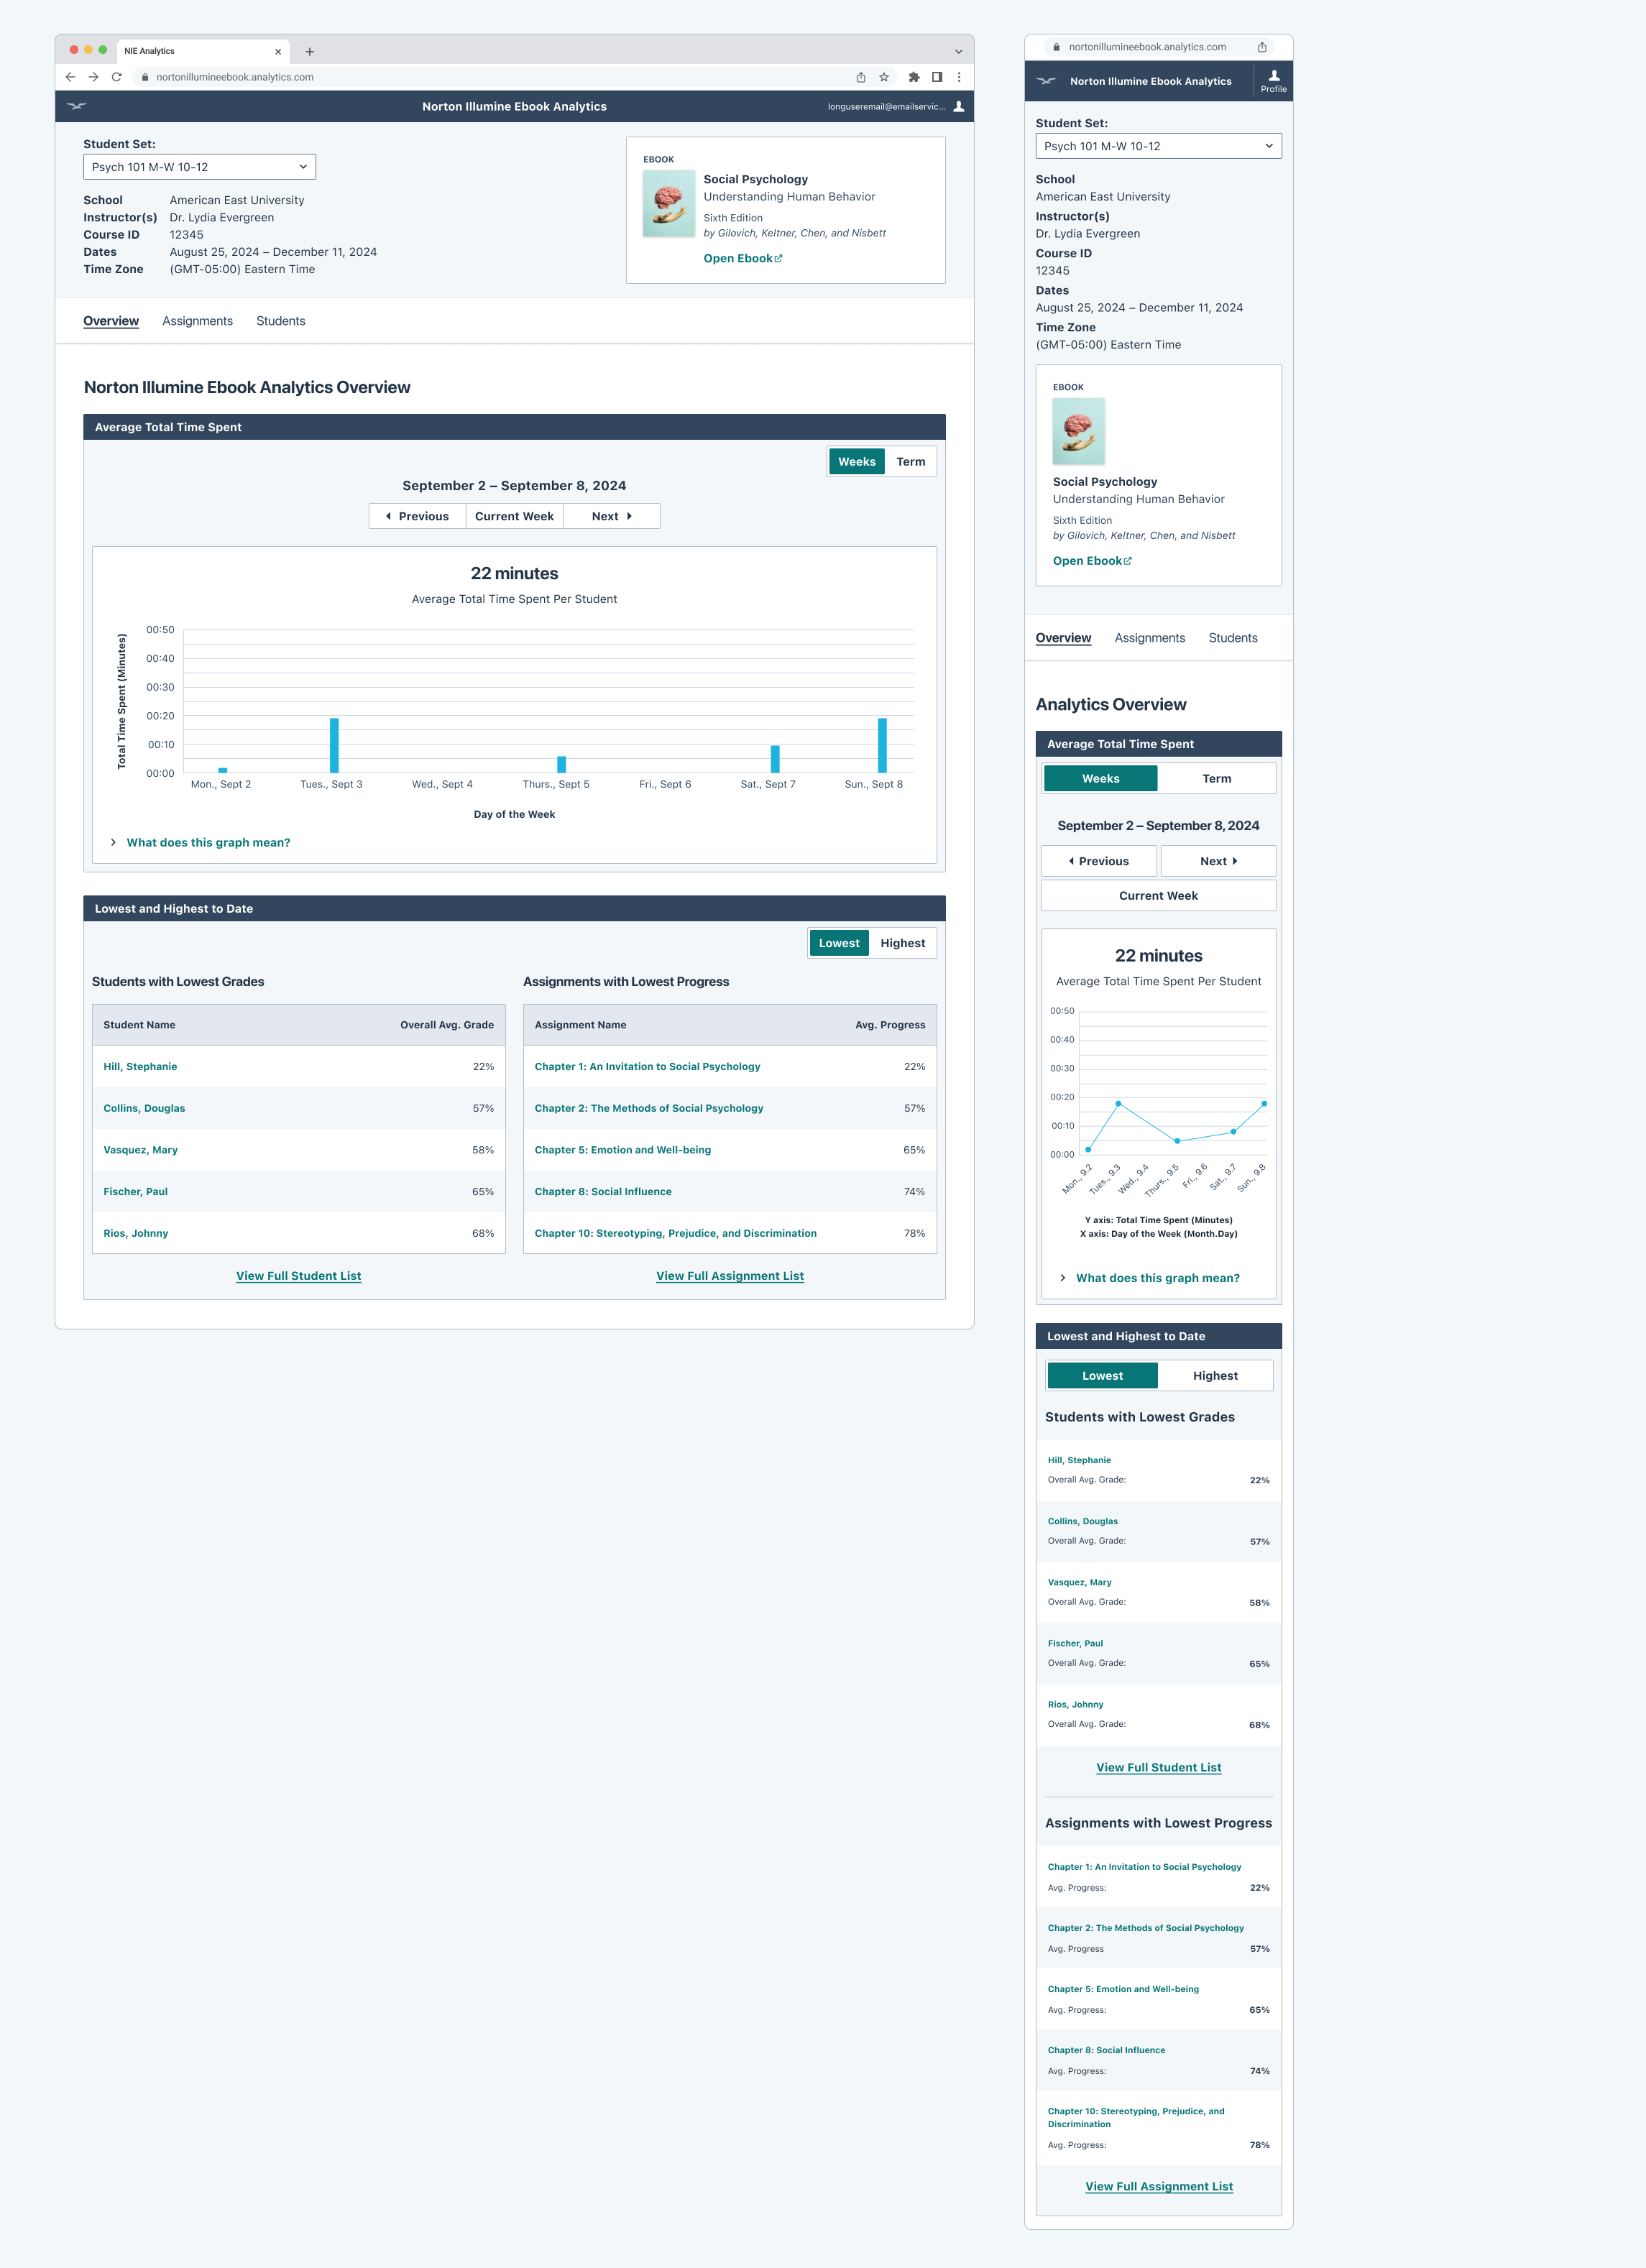
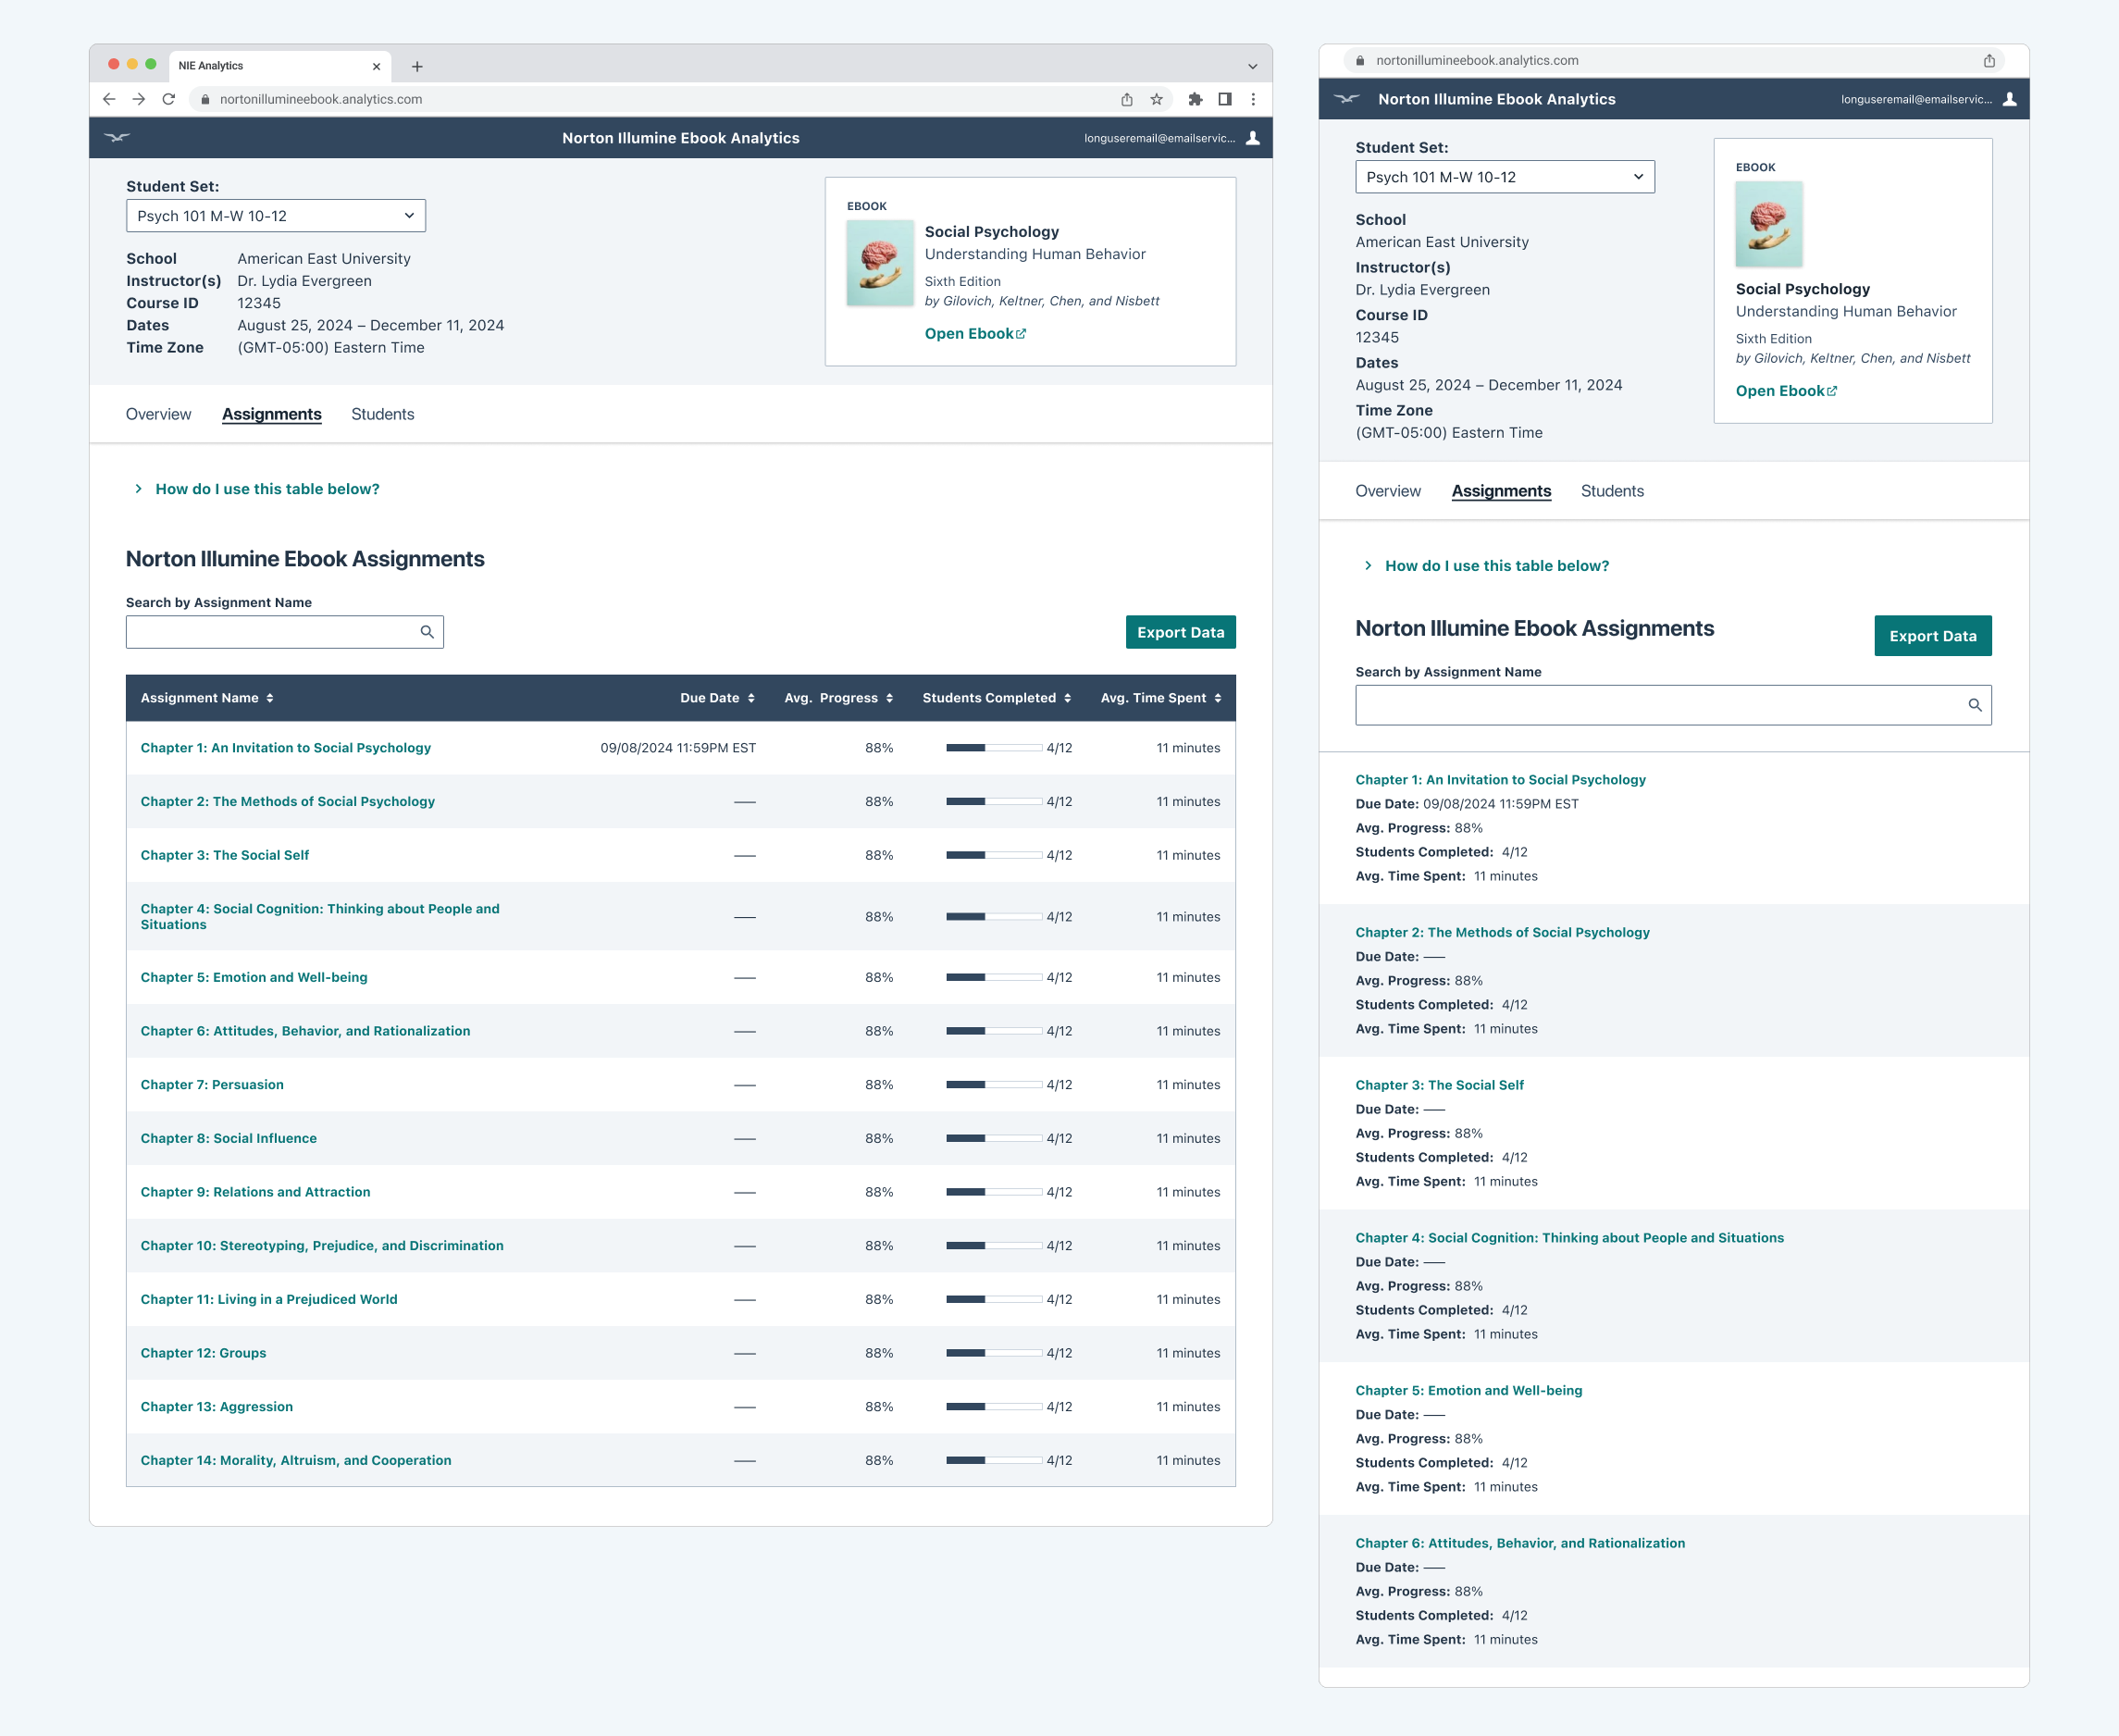
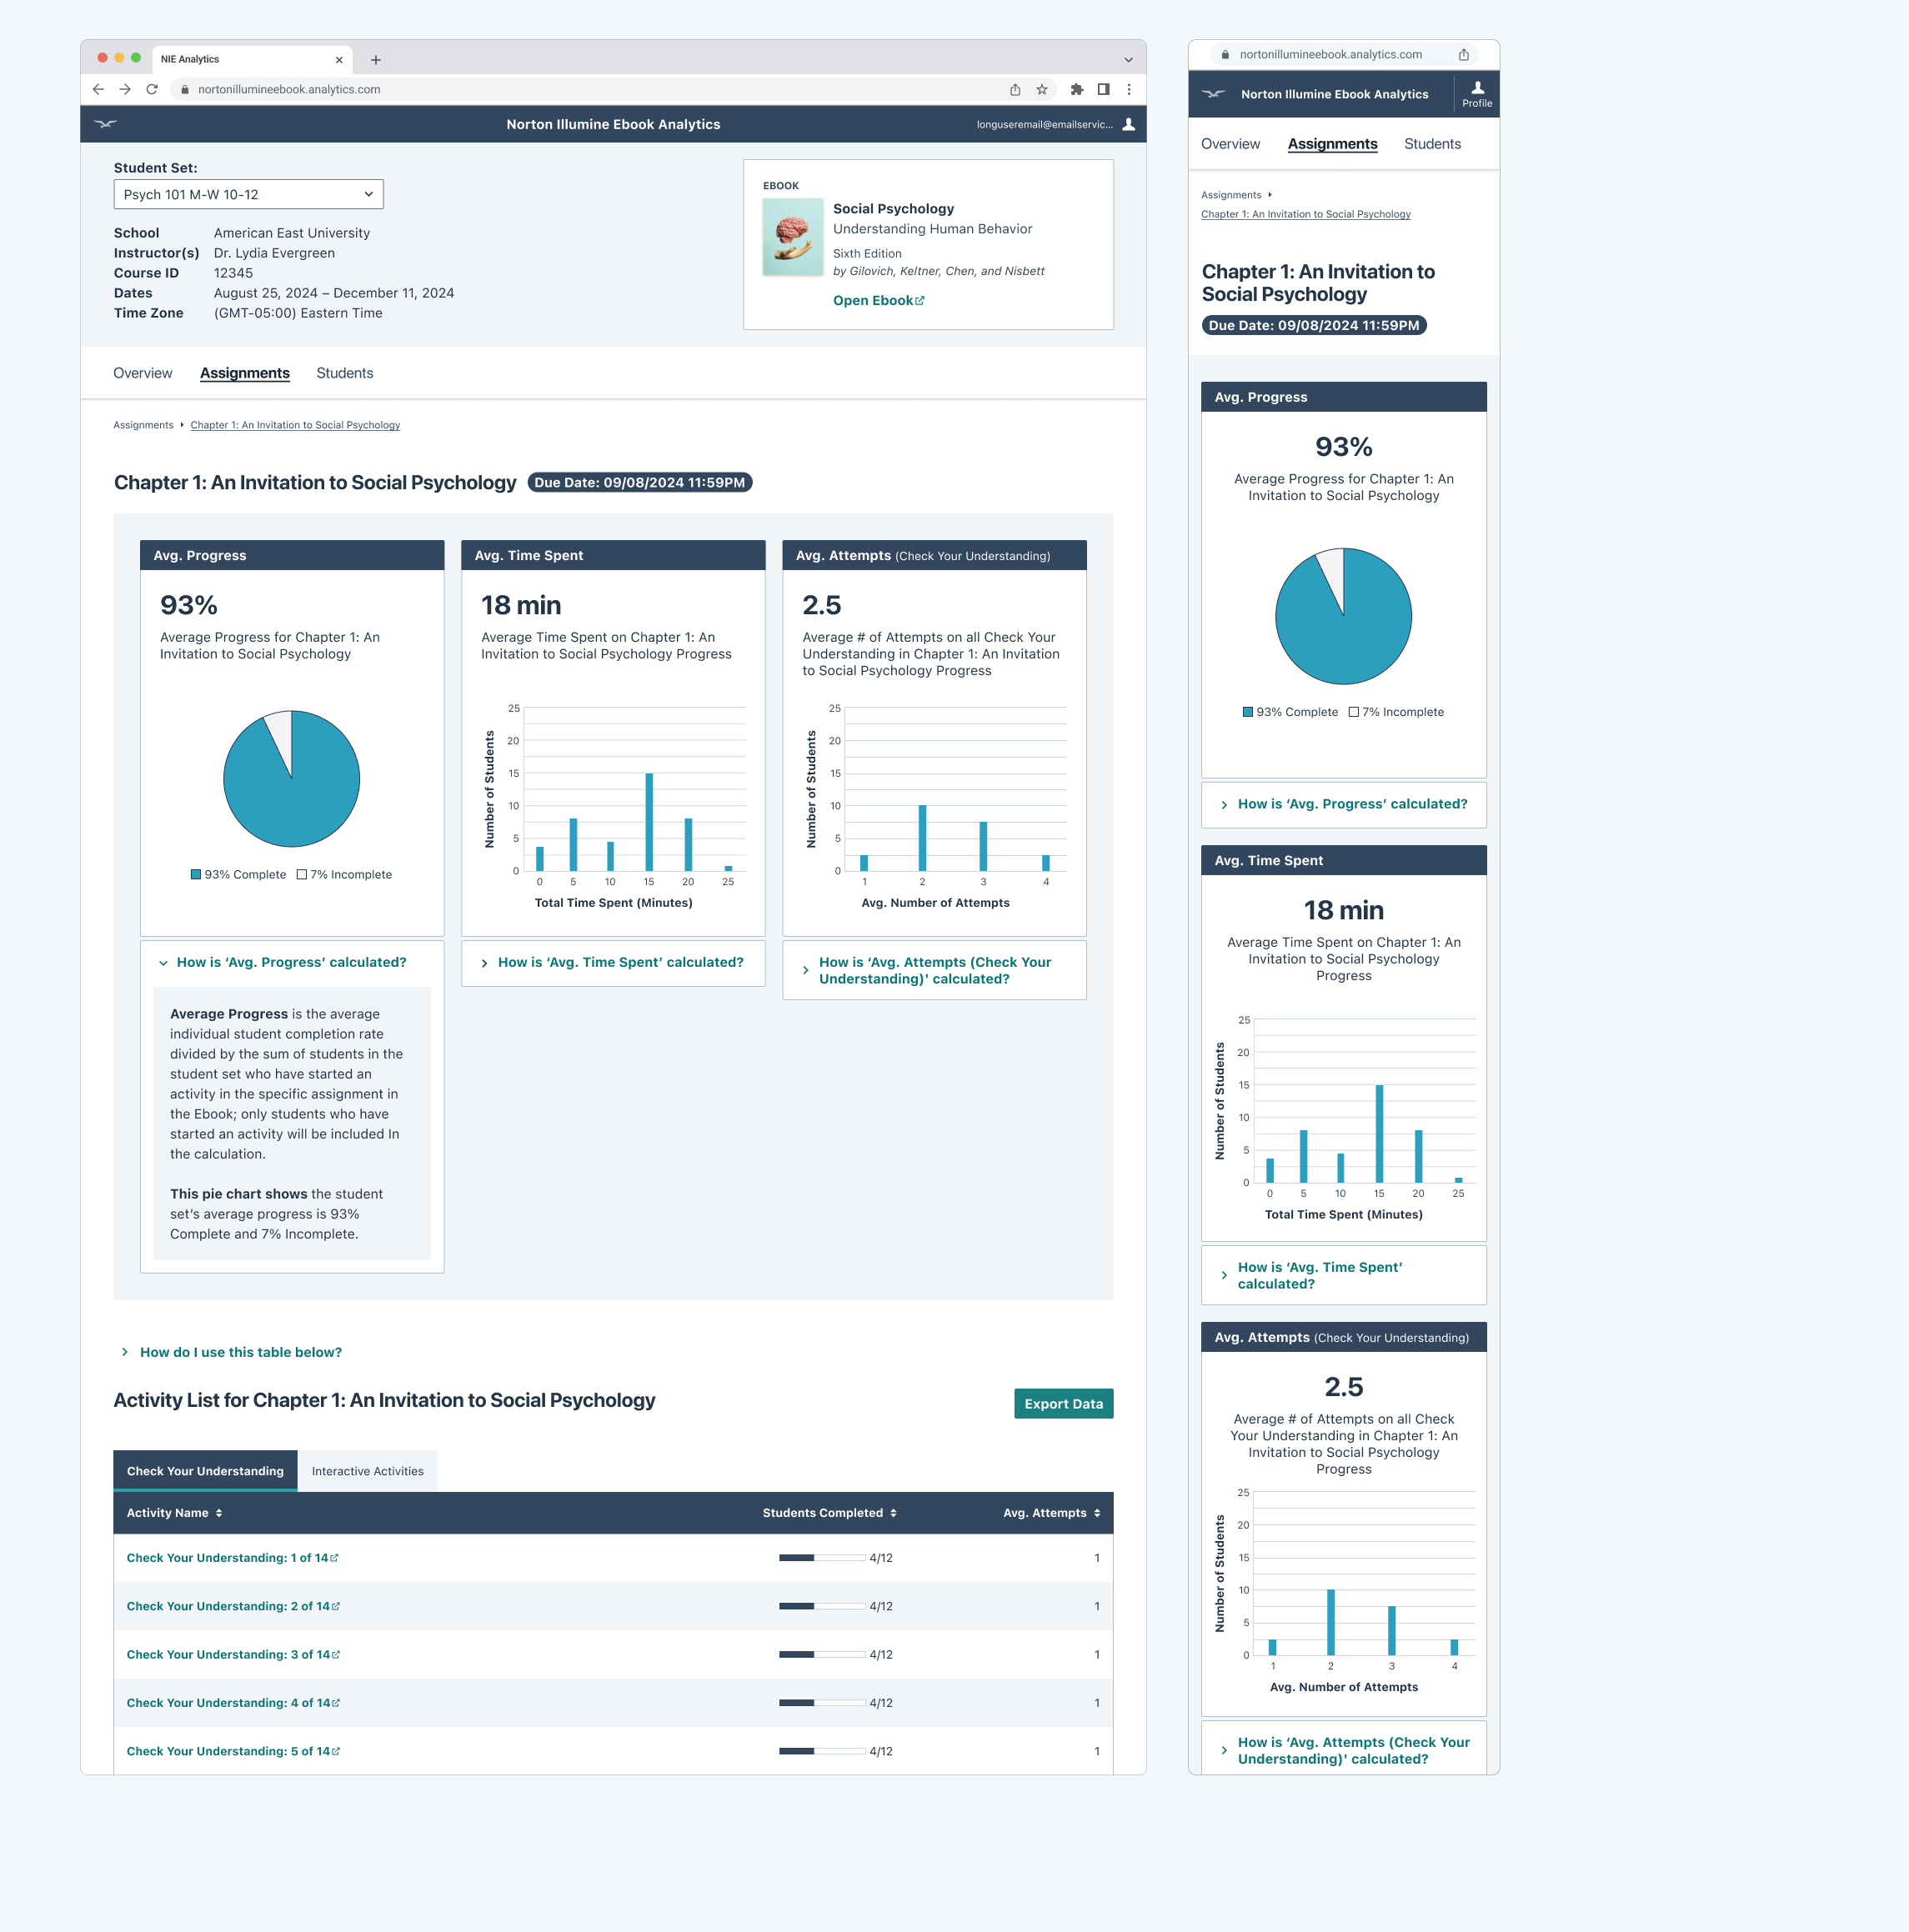
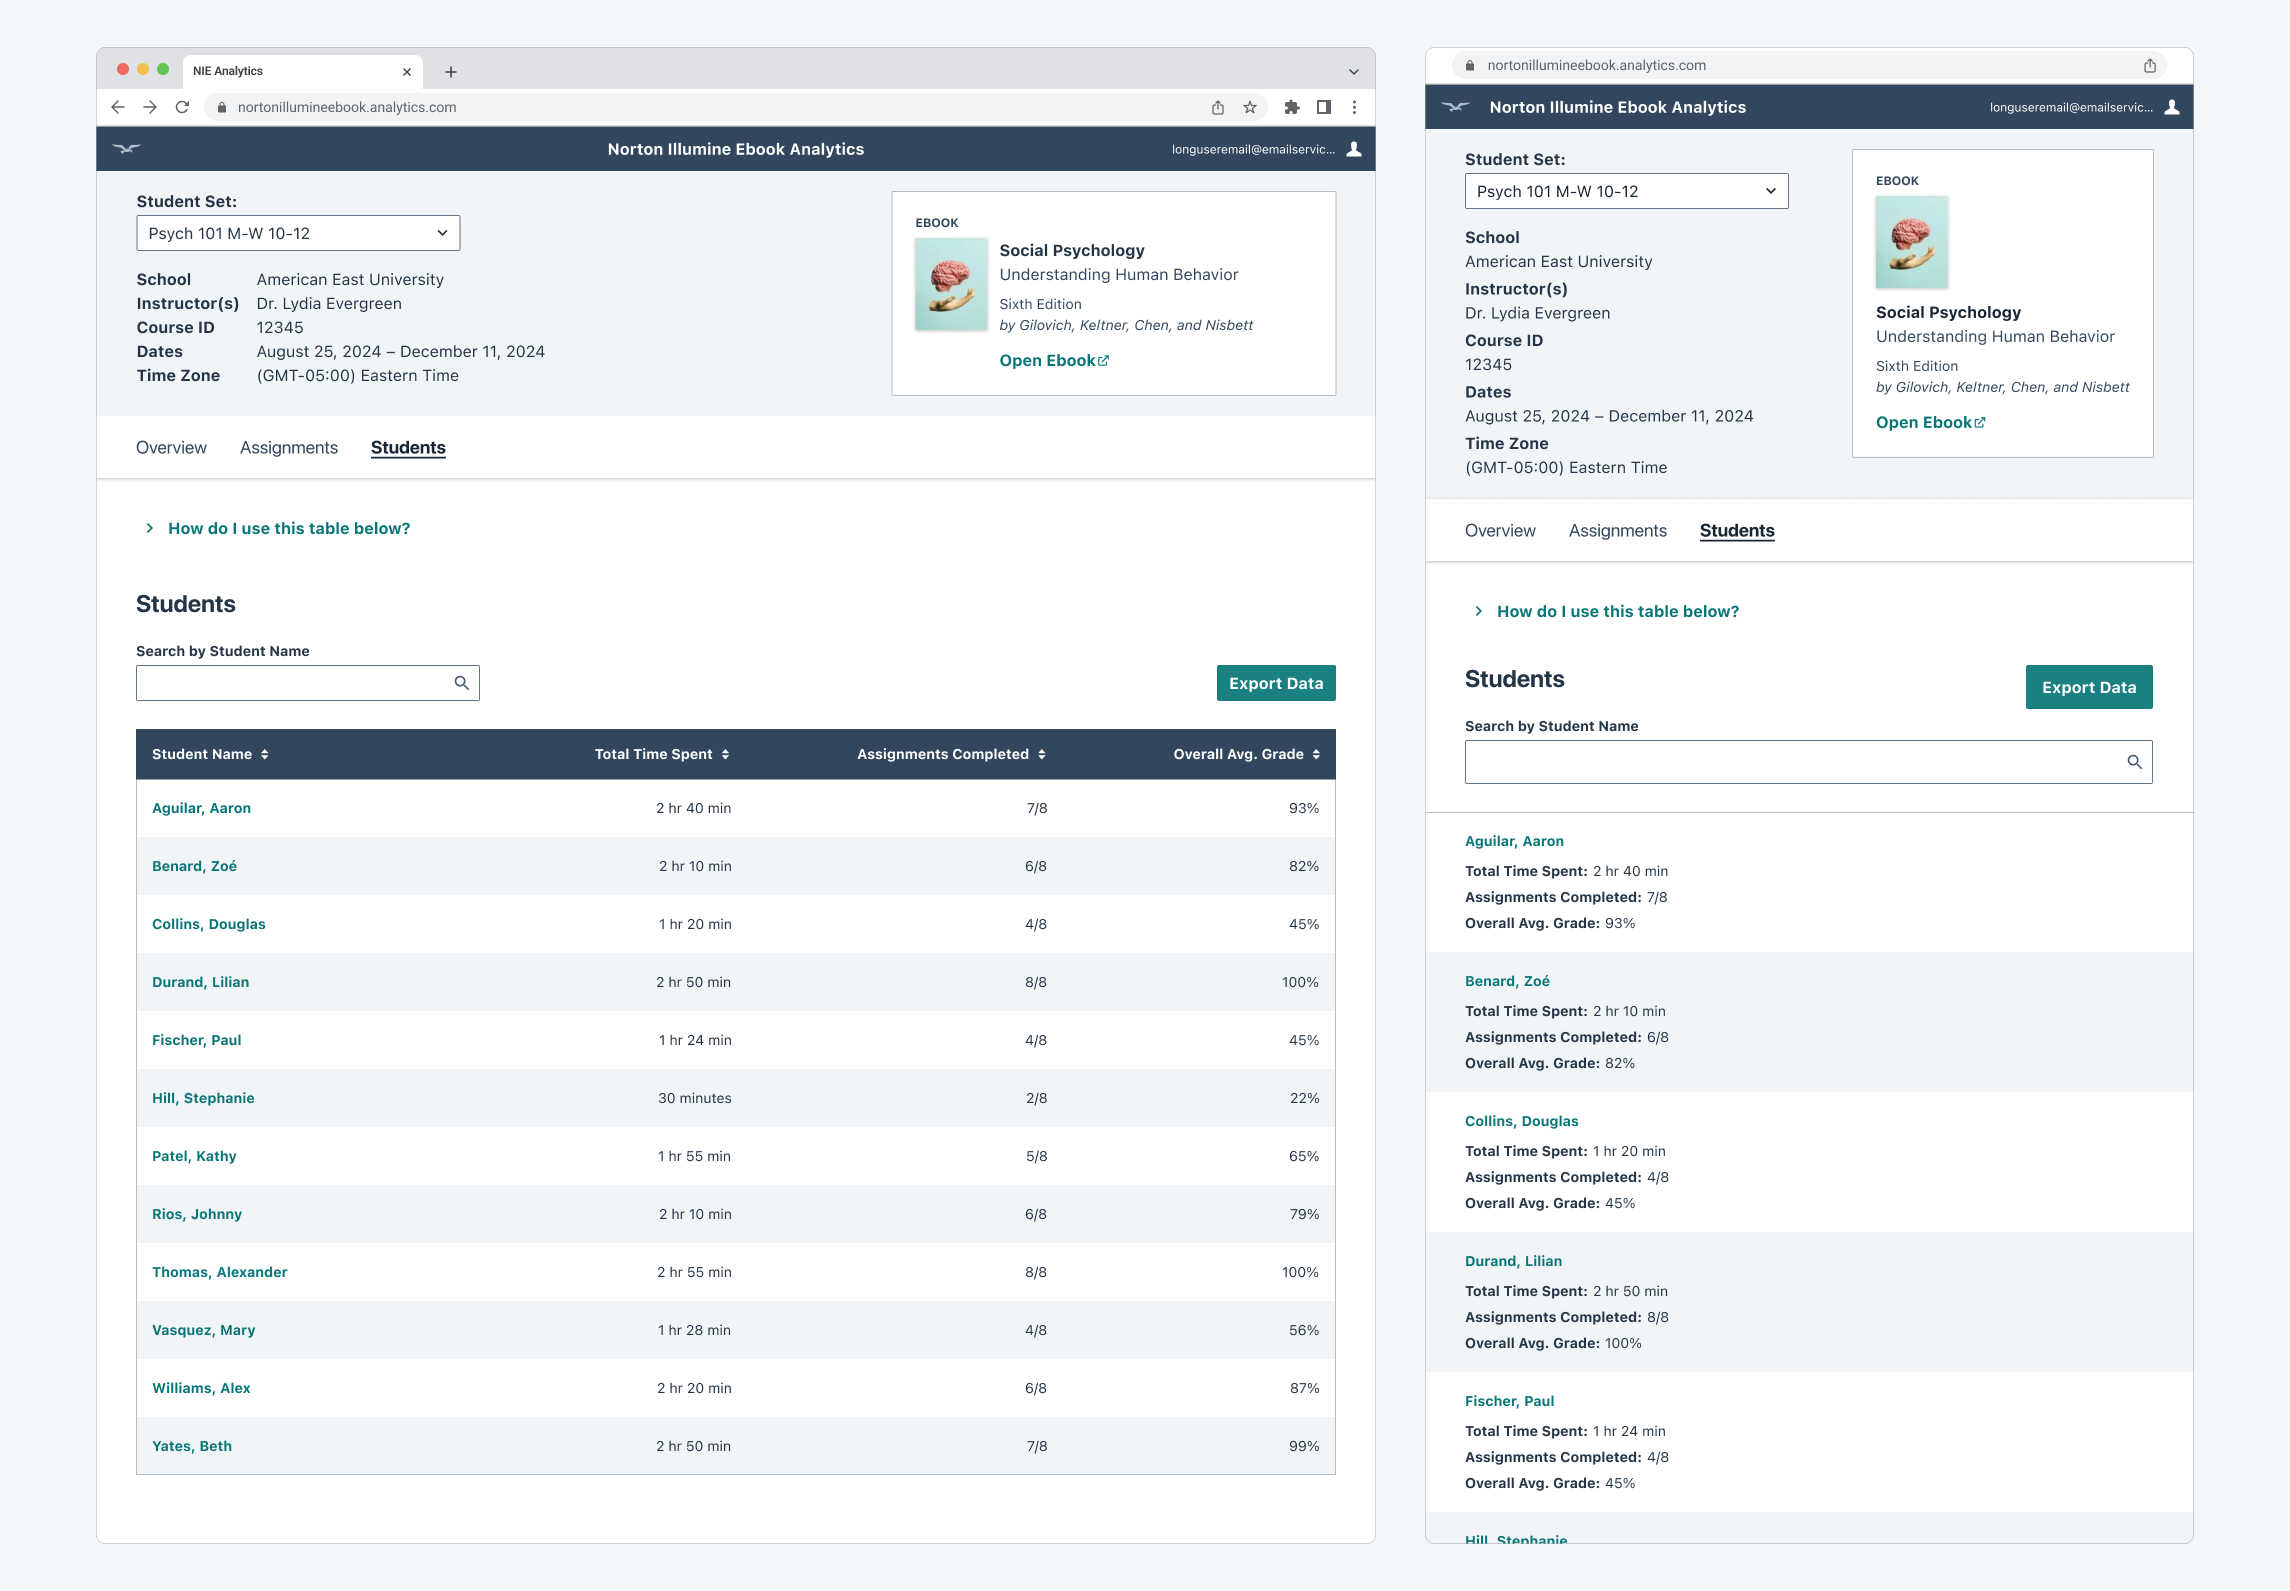
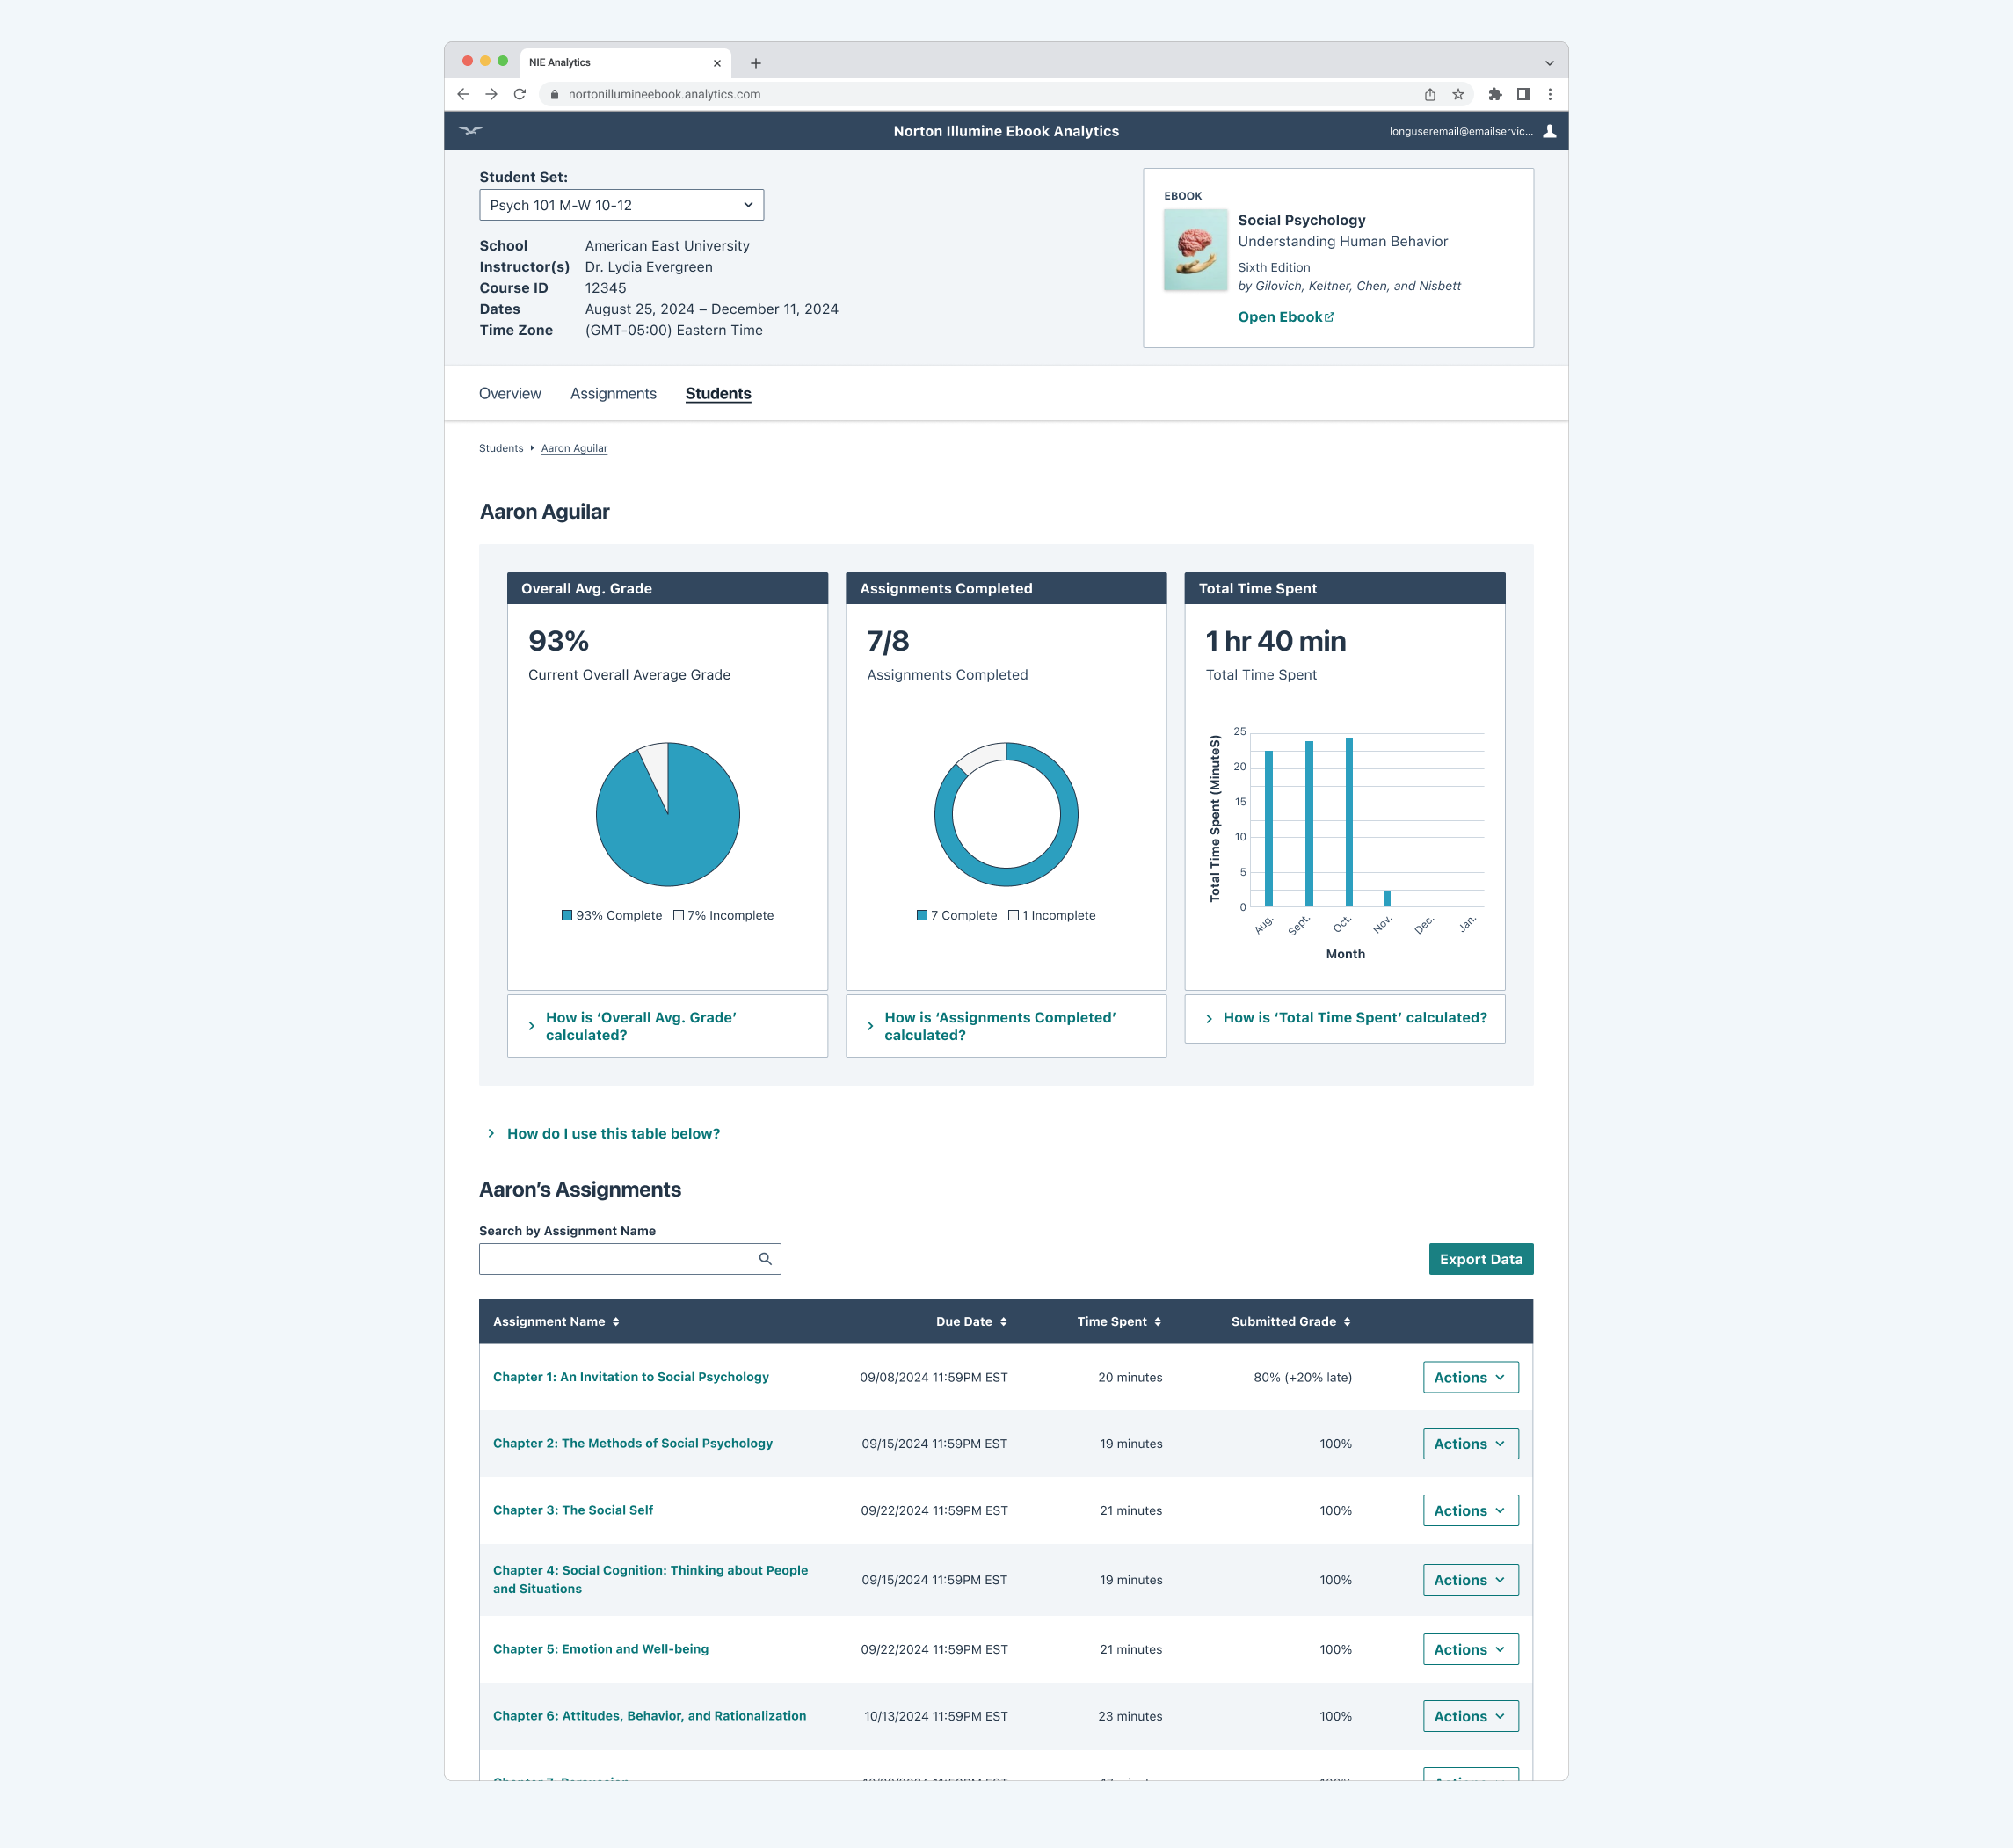
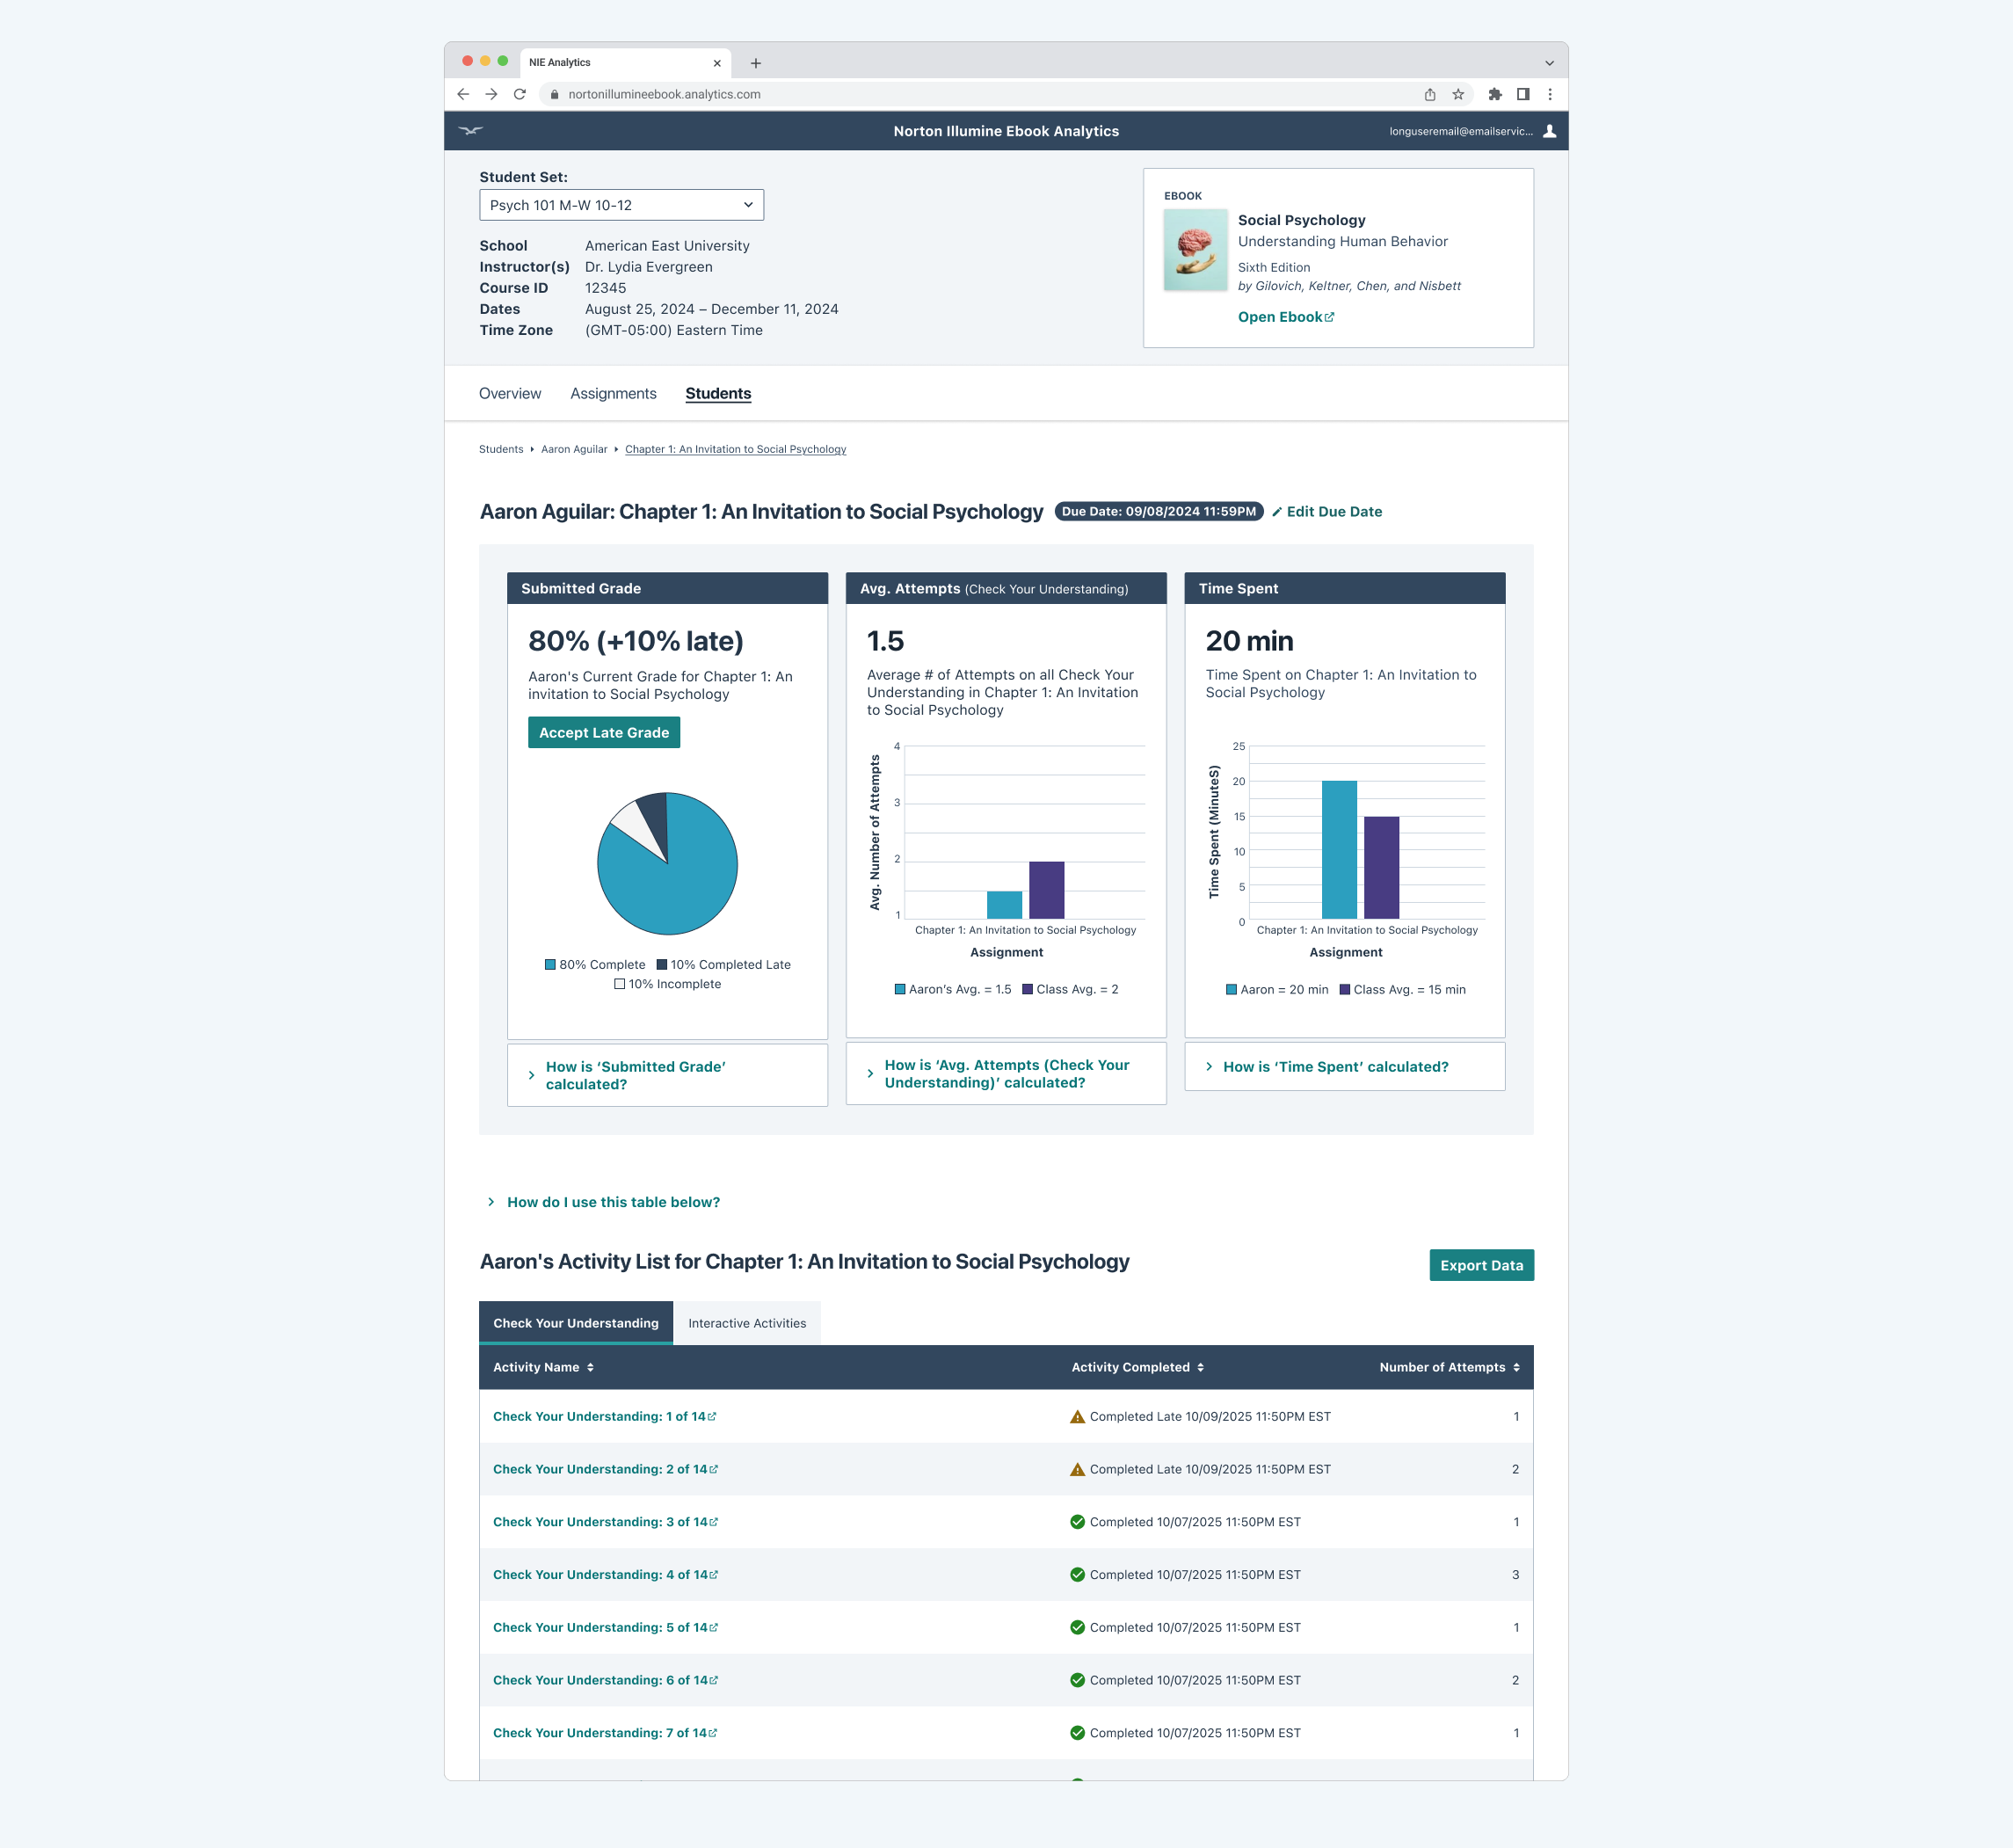
Solution: Our team designed, tested, and launched an analytics platform that shows instructors how much time students are spending in their course ebook, how many homework assignments they have completed, and their overall average grades. An “Overview” page also presents high-level class data, alerting instructors to which students are struggling the most and which homework assignments have the lowest grades.
Process: Our team began the project with a week-long, in-person design sprint workshop, where we gathered insights from stakeholders and brainstormed what success would look like. The sprint concluded with a variety of low-fidelity mockups.
The UX team then took it from there, developing a working prototype that was tested by a group of instructors. We presented our findings to the larger group and refined the prototype to better align with users’ needs.
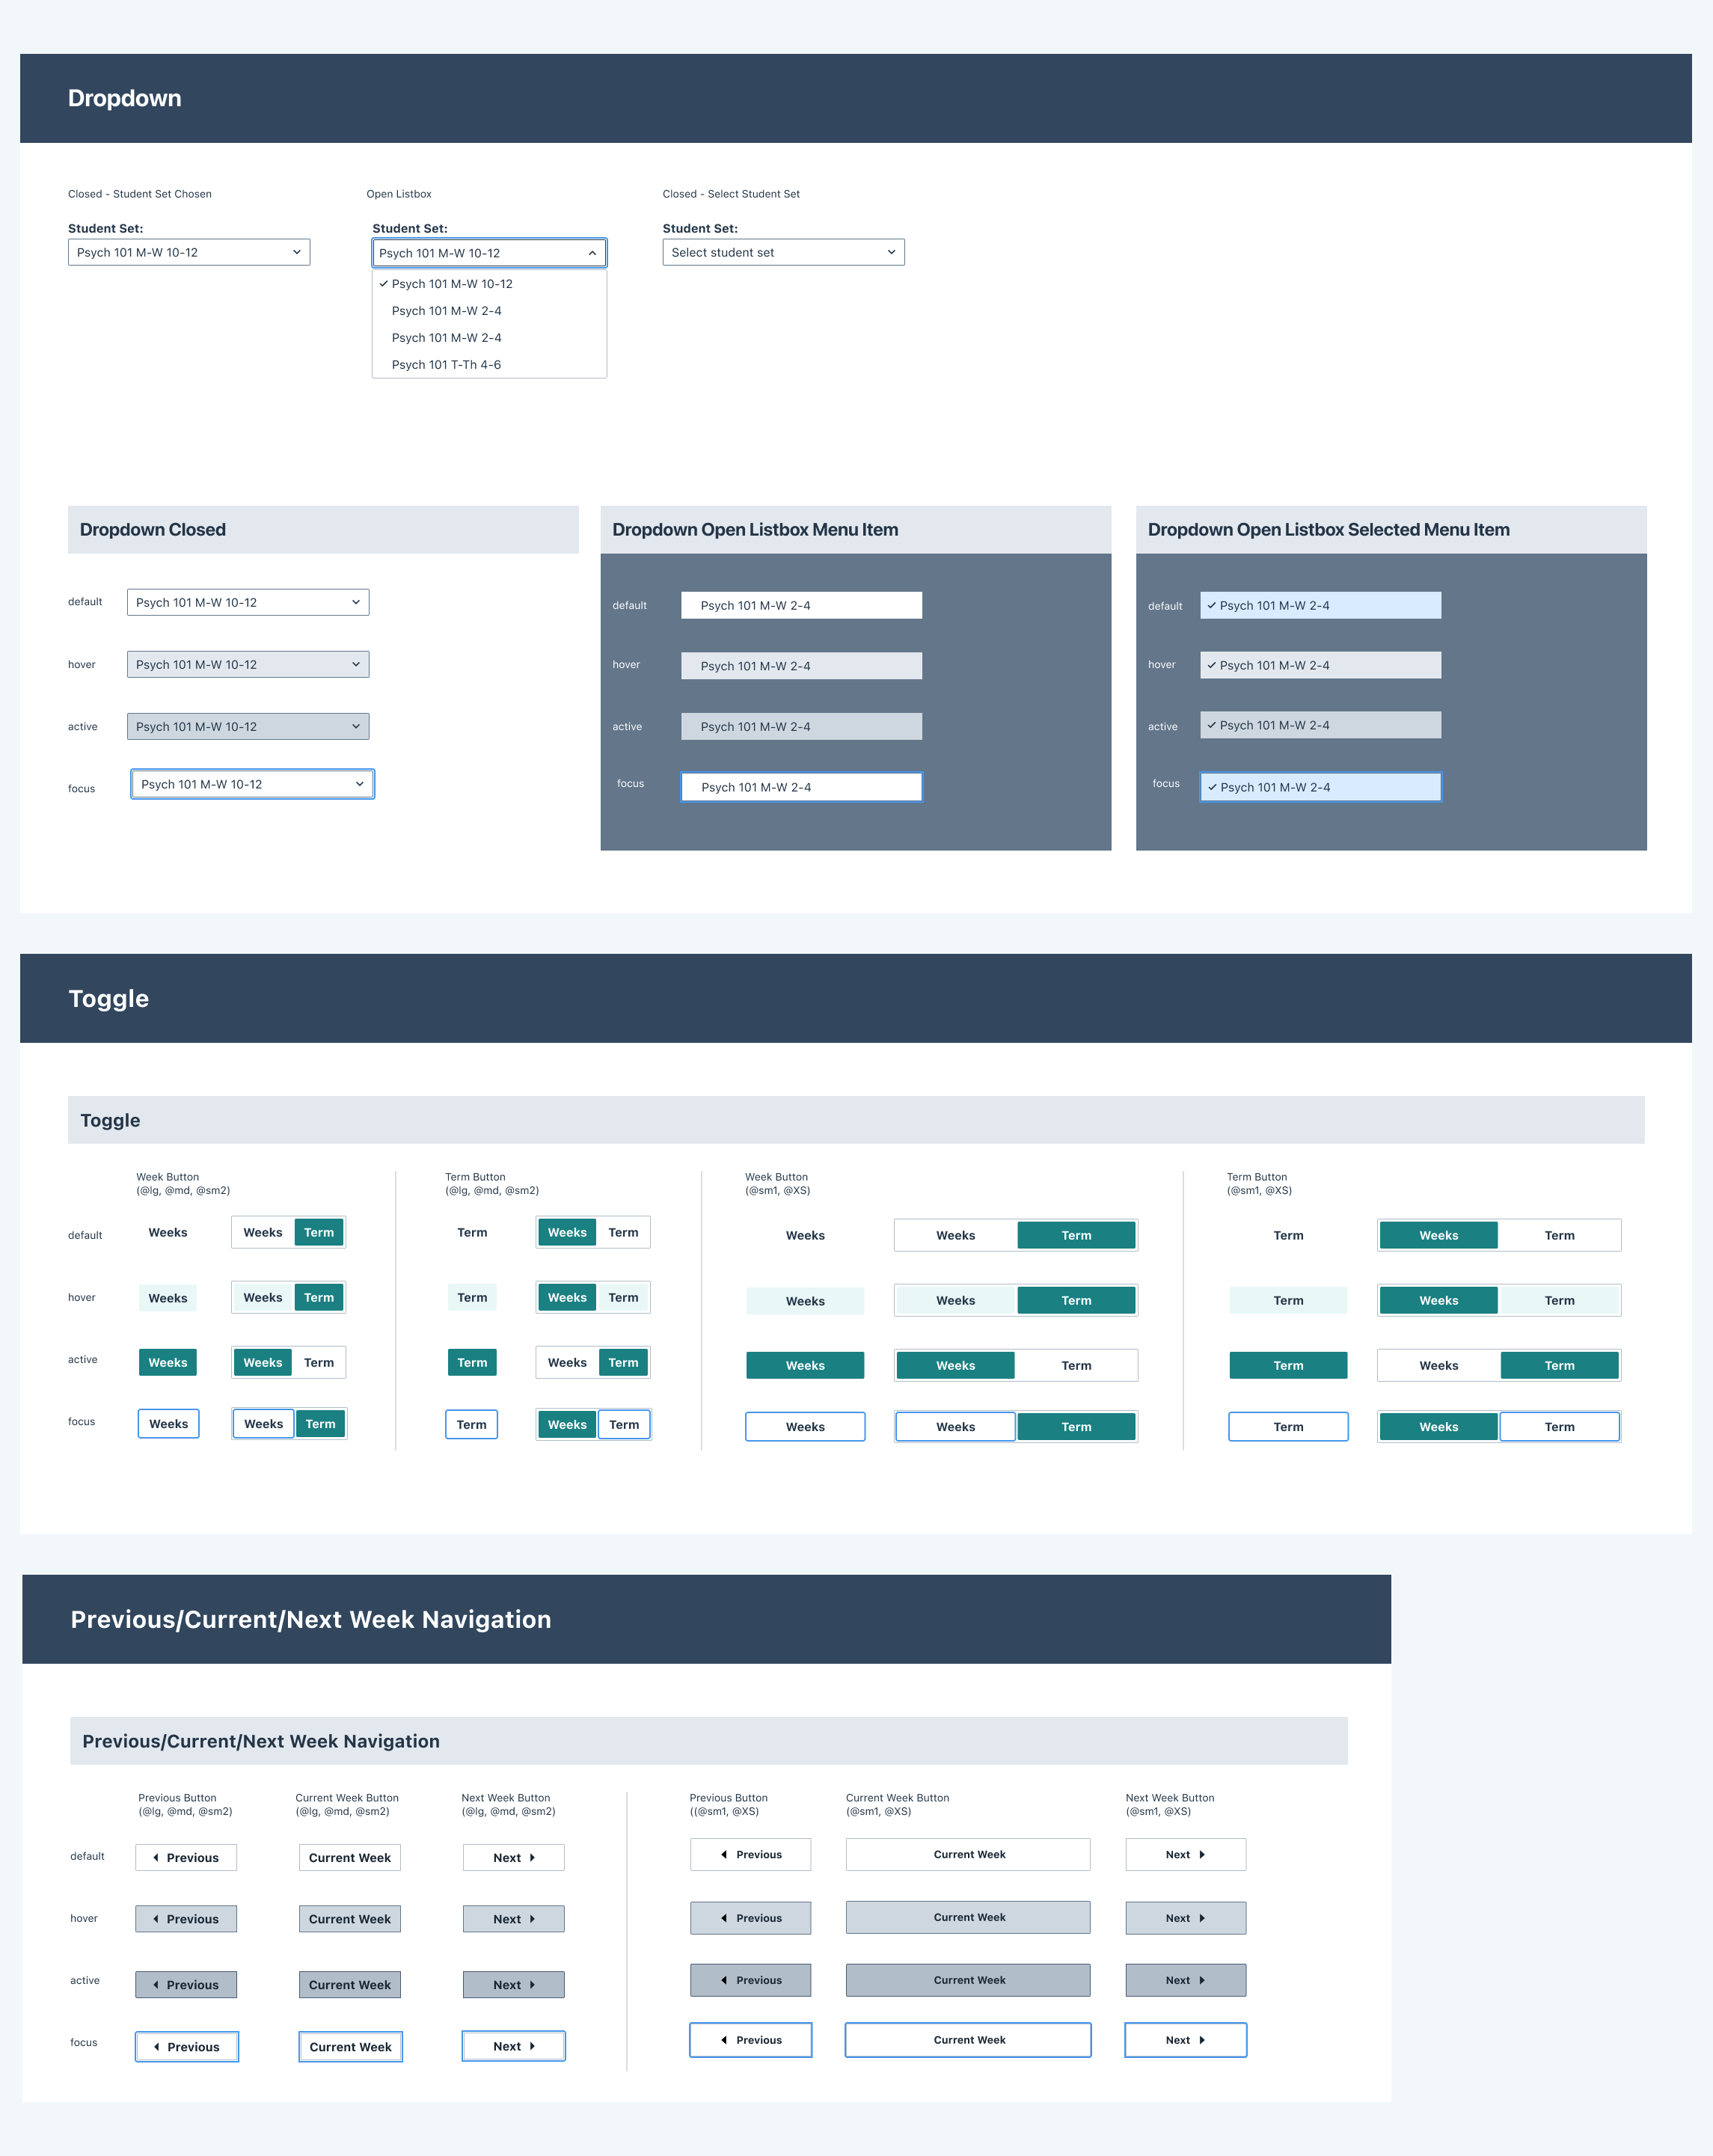
Once the prototype was approved, I polished the UI by leveraging our existing design system and building new components as needed. We then worked closely with the development team to launch the final product.
My role: UX Designer & Visual Designer